

Increase in the Number of International Students in the USA
There were more than 1.1 million international students in the USA during the 2023—2024 academic year. This information was published in an Open Doors® 2024 report.
The data has been compiled by the U.S. Department of State’s Bureau of Educational and Cultural Affairs and the Institute of International Education (IIE).
The report states that international student enrollment reached 1,126,690 during the year. This is a 7% increase from 2022/23.
The all-time high (ATH) falls on the 75th annual anniversary of the Open Doors programme.
This program, though it’s been around since 1949, was only renamed to “Open Doors” in 1954—1955. Since then, it has served as the main benchmark for international educational exchange in the USA.
If you’re looking for data on international higher education in the USA, the annual Open Doors report serves as a reliable resource.
Economic contributions of international students
Anyhow, this 2024 report also goes on to state that 6% of all students in the USA who are pursuing higher education are internationals. It then goes on to say that these students contributed well north of $50 billion to the economy in 2023 alone. That fact is corroborated via a study by the U.S. Department of Commerce, which is mentioned in the report.
Shifting demographics and educational trends
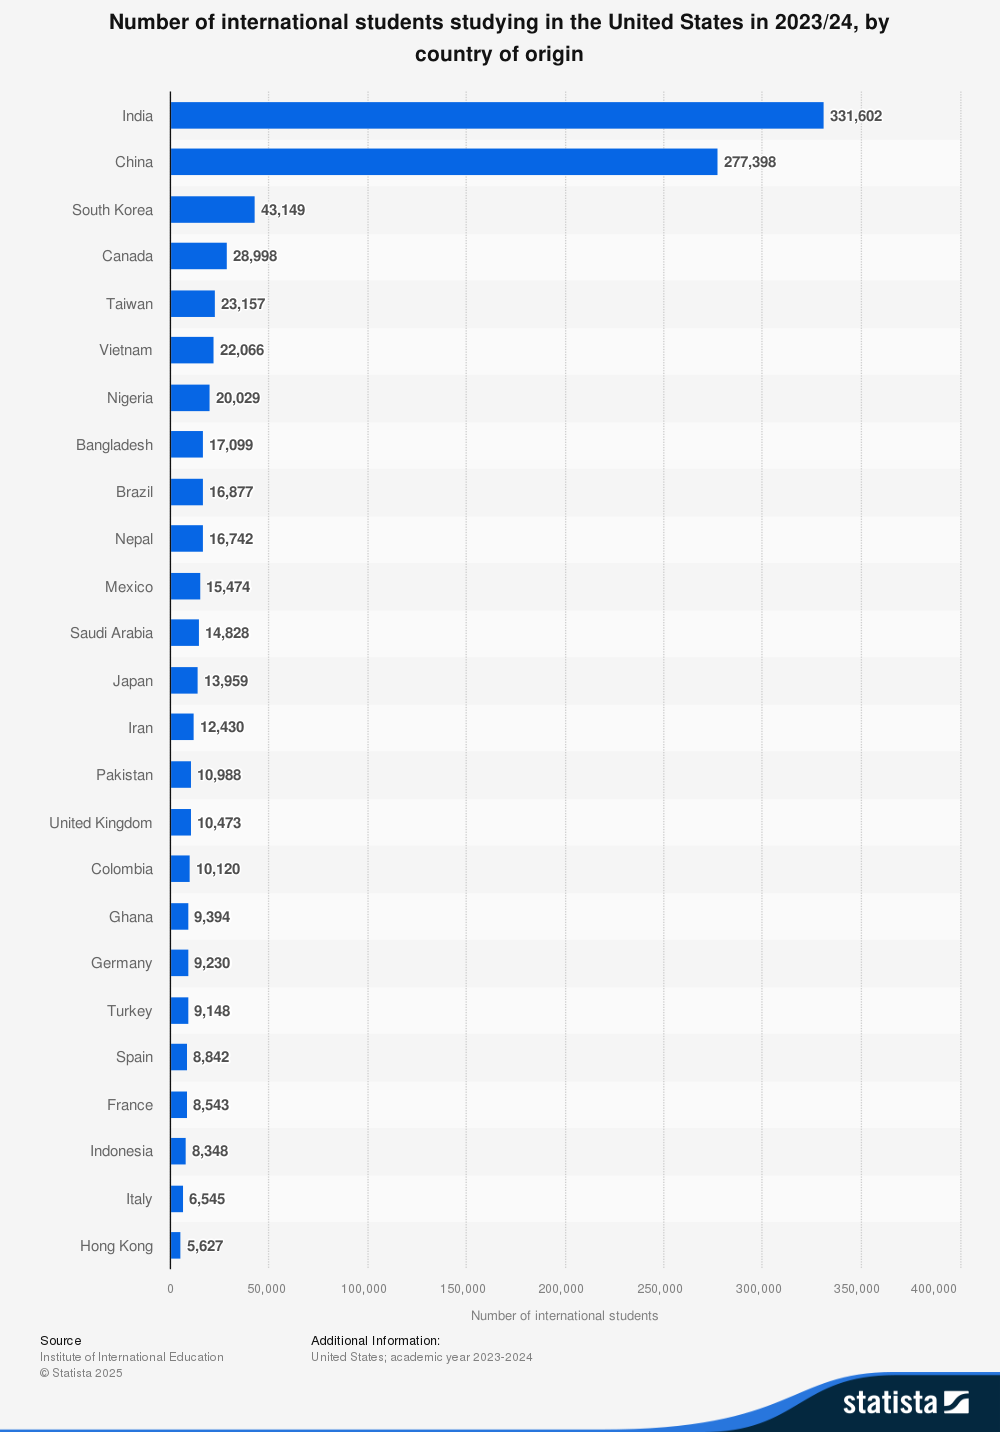
A closer look at the numbers reveals important changes in the demographics of international students. For the first time since 2009, India has become the leading source of international students in the USA.
The 2023–2024 academic year saw 331,602 Indian students enrolled. This was a 23% increase from the previous year.
For reference, here is the split between Indian and Chinese international students in the USA for the preceding year, 2022—2023:
Source: Statista
Indian student enrollment saw significant growth at both the graduate level (196,567 students, +19%) and in Optional Practical Training participation (97,556 students, +41%).
Optional Practical Training is the 1-year period after graduation where international students in the USA are allowed to get work experience in the country. This can be extended from 1 year to 3 years for certain programmes classified as “STEM”.
As per the report, China has moved to the second position with 277,398 students, despite a 4% decline.
That said though, China was still the #1 feeder for undergraduate and non-degree programs. For these, Chinese students stood at 87,551 and 5,517 respectively. Also, Chinese OPT participation is up 12%, at 61,552
Together, India and China account for more than half of all international students in the United States.
Trends across academic levels
Other notable trends from the report include:
- The number of graduate students also reached an all-time high of 502,291. This is an 8% upside.
- OPT numbers also hit an ATH, with a 22% increase to 242,782.
- Undergraduate enrollment showed a 1% decrease, now at 342,782.
- New international enrollment matched pre-pandemic levels at 298,805.
While these figures capture the broader trends, the geographic distribution of international students reveals even more insights.
Geographic distribution
The presence of international students in the USA expanded rather unevenly across the various states.
A total of 44 states reported increased enrollment. The report considers “increased enrollment” to be a jump of 2.5% or greater, to account for year-on-year standard deviation.
The largest international student populations are in Texas, California, and New York. Amongst the top 10 states, the Midwest showed a huge increase. Illinois enrollment stood at 13%, Michigan at 14%, and Missouri at 35%.
According to NAFSA, international students in the USA supported more than 378,000 jobs in the economy during the year.
The report goes on to estimate that one job is created for every three international student enrollments.
Twelve states in total had their income from these students cross the $1 billion mark, which again, is an all-time high record.
Diversity in student origins and academic focus
The report also highlights growing diversity among international student origins. Eight of the top 25 sending countries reaching all-time highs.
These countries are Bangladesh, Colombia, Ghana, India, Italy, Nepal, Pakistan, and Spain. Sub-Saharan Africa showed particularly strong growth, with a 13% increase in 2023/24. It is the highest growth rate among all world regions for the second consecutive year.
Then, in terms of degree area, the focus was on science, tech, and math. A grand total of 56% of students across all academic levels enrolled in these disciplines. Mathematics and computer science attracted 25% of international students, while engineering programs drew 19%.
Looking ahead
Looking ahead, the Fall 2024 International Student Enrollment Snapshot indicates continued growth.
There is a 3% rise in international student enrollment at the start of the 2024/25 academic year.
Undergraduate enrollments have also increased by 6%, while graduate enrollments showed a slight decrease of 2%.